The Back-To-Back Stemplot
A back-to-back stemplot is used for numerical data, where two sets of data use the same set of stems, but one data set radiates to the left and the other radiates to the right. By displaying two sets of data in one stemplot, we are able to easily make comparisons of two groups.
The following back-to-back stemplot displays the scores on the final exam for a Statistics professor's Monday class (n = 29) and Wednesday class (n = 22), respectively. The scores are raw scores out of a possible 100 points.
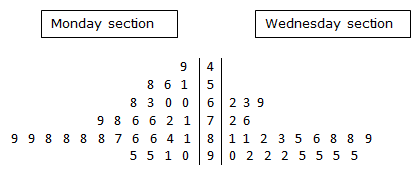
The central stem allows for reading the Wednesday section data from left to right, but the Monday data has to be read from right to left. We can see that, for example, the Monday section had 3 scores in the 50s (51, 56, 58), whereas the Wednesday section had no scores in the 50s. We can also see that, for example, the Wednesday section has 2 scores in the 70s (72 and 76), whereas the Monday section had 6 scores in the 70s (71, 72, 76, 76, 78, and 79).
We can see that the stemplot also allows for comparison of the two groups' final exam scores. Note that you can see that the mean (average) of the Wednesday group is higher than the mean of the Monday group. The variability of the two groups is different, too. The range of the Monday section is from 49 to 95, a range of 46 points between the lowest and highest scores. The range of the Wednesday section is smaller, with a low of 62 and a high of 95, yielding a range of 33. Even without calculating the ranges, the lower variability of the Wednesday section is apparent just by visual inspection of the two stemplots.
The shapes of the two groups' scores are different as well. If you turn your head 90 degrees to the right, you can see that the Wednesday group's distribution is very tall in the 80s and 90s, and there is a steep drop-off in the 70s and 60s. To interpret the shape of the Monday section, you can turn your head 90 degrees to the left this time. You will see that it is very tall in the 80s and then it tapers down slowly as it moves through the 70s, 60s, 50s, and 40s.
The professor can use the information from The Back-To-Back Stemplot to realize that there are differences in the performances of the two groups. She might then consider why these differences exist and then change those things under her control to create a better learning environment for her future students.
The following back-to-back stemplot displays the scores on the final exam for a Statistics professor's Monday class (n = 29) and Wednesday class (n = 22), respectively. The scores are raw scores out of a possible 100 points.
The central stem allows for reading the Wednesday section data from left to right, but the Monday data has to be read from right to left. We can see that, for example, the Monday section had 3 scores in the 50s (51, 56, 58), whereas the Wednesday section had no scores in the 50s. We can also see that, for example, the Wednesday section has 2 scores in the 70s (72 and 76), whereas the Monday section had 6 scores in the 70s (71, 72, 76, 76, 78, and 79).
We can see that the stemplot also allows for comparison of the two groups' final exam scores. Note that you can see that the mean (average) of the Wednesday group is higher than the mean of the Monday group. The variability of the two groups is different, too. The range of the Monday section is from 49 to 95, a range of 46 points between the lowest and highest scores. The range of the Wednesday section is smaller, with a low of 62 and a high of 95, yielding a range of 33. Even without calculating the ranges, the lower variability of the Wednesday section is apparent just by visual inspection of the two stemplots.
The shapes of the two groups' scores are different as well. If you turn your head 90 degrees to the right, you can see that the Wednesday group's distribution is very tall in the 80s and 90s, and there is a steep drop-off in the 70s and 60s. To interpret the shape of the Monday section, you can turn your head 90 degrees to the left this time. You will see that it is very tall in the 80s and then it tapers down slowly as it moves through the 70s, 60s, 50s, and 40s.
The professor can use the information from The Back-To-Back Stemplot to realize that there are differences in the performances of the two groups. She might then consider why these differences exist and then change those things under her control to create a better learning environment for her future students.
|
Related Links: Math Probability and Statistics Bar Chart Histogram Pie Chart Caluclate Mode and Median Probability and Statistics Quiz |
To link to this The Back-To-Back Stemplot page, copy the following code to your site: