Graphing a Sine Function
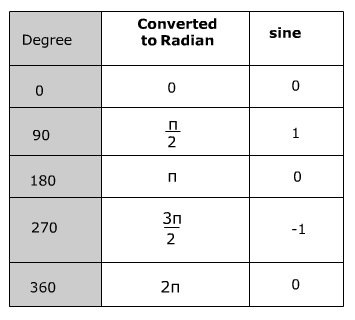

Notice that the domain for the period is from 0 to 2π which is from 0 to 360° and the range is from -1 to 1. However, when you include more than one period the domain becomes all real numbers and the range remains -1 to 1.
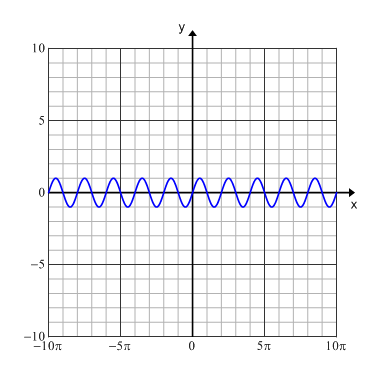
When sine is graphed over several periods (multiple cycles) it creates what is known as the sine wave. The graph above is an example of sin(x) graphed over multiple periods. This graph is also known as a sinusoidal graph. Recall from right triangle trigonometry that a reference angle (an angle between 0° and 360°) can be used to represent all angles that are less than zero or greater than 360°. Therefore the sine values will repeat every 360° creating the sine wave.
Sound waves are an example of a sine wave. So every time you listen to the radio, play a musical instrument or look at a tide a sine wave is being created.
|
Related Links: Math Trigonometry Graphing the Tangent Function The Cosine Function in Right Triangles |
To link to this Graphing a Sine Function page, copy the following code to your site: