Finding and Graphing the Foci of a Hyperbola
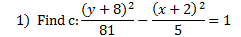
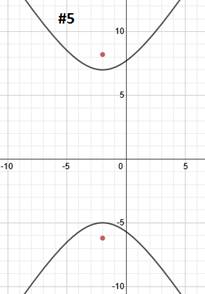
Here's an example of a hyperbola with the foci (foci is the plural of focus) graphed:
The distance from the center point to one focus is called c and can be found using this formula:
Let's find c and graph the foci for a couple hyperbolas:

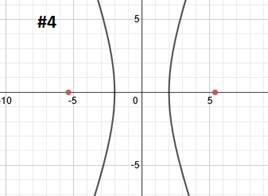
This hyperbola has already been graphed and its center point is marked:
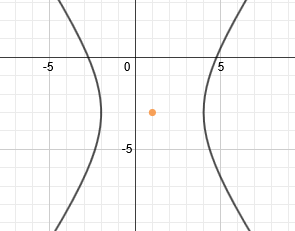
We need to use the formula c2 = a2 + b2 to find c. Now, we could find a and b and then substitute, but remember that in the pattern, the denominators are a2and b2, so we can substitute those right into the formula:
We need to use the formula c2 = a2 + b2 to find c. Now, we could find a and b and then substitute, but remember that in the pattern, the denominators are a2and b2, so we can substitute those right into the formula:
c2 = a2 + b2
c2 = 9 + 16
c2 = 25 We'll need to take the square root.
c = 5
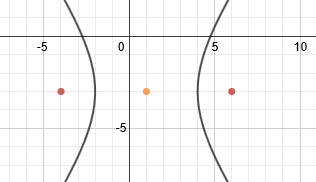
We can plot the foci by counting 5 spaces from the center. Note that we are not counting 5 spaces from the vertex. Since the hyperbola is horizontal, we will count 5 spaces left and right and plot the foci there.c2 = 9 + 16
c2 = 25 We'll need to take the square root.
c = 5
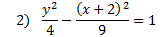
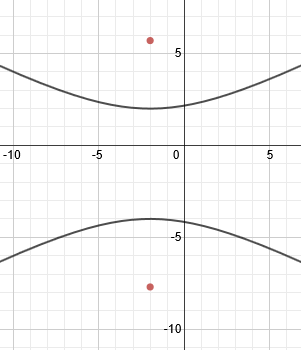
This hyperbola has already been graphed and its center point is marked:
We need to use the formula c2=a2+b2 to find c. Since in the pattern the denominators are a2and b2, we can substitute those right into the formula:
We need to use the formula c2=a2+b2 to find c. Since in the pattern the denominators are a2and b2, we can substitute those right into the formula:
c2 = a2 + b2
c2 = 4 + 9
c2 = 13 We'll need to take the square root.
c ≈ 3.6
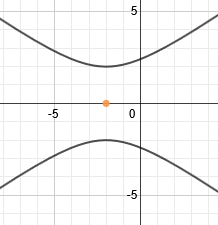
We can plot the foci by counting about 3.6 spaces from the center. We'll have to estimate somewhat, but we can be fairly accurate.Since the hyperbola is vertical, we will count 3.6 spaces up and down and plot the foci there.c2 = 4 + 9
c2 = 13 We'll need to take the square root.
c ≈ 3.6