Graphing Ellipses
Now we will take this information and use it to graph an ellipse.
Before we do that, though, let's review the patterns:

To graph an ellipse:
1. Find and graph the center point.
2. Determine if the ellipse is vertical or horizontal and the a and b values.
3. Use the a and b values to plot the ends of the major and minor axis.
4. Draw in the ellipse.
2. Determine if the ellipse is vertical or horizontal and the a and b values.
3. Use the a and b values to plot the ends of the major and minor axis.
4. Draw in the ellipse.
Let's graph a couple, and you'll see how it works.
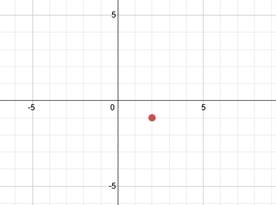
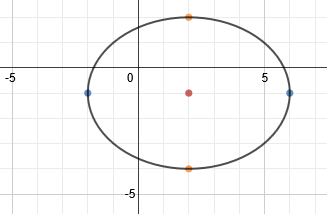
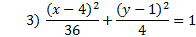
First we must identify the center point, which is (2, -1). (Remember that you must take the opposite of each number inside the parenthesis.) Let's graph that point:
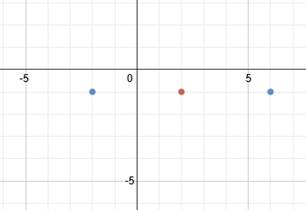
Now we need to determine if the ellipse is vertical or horizontal. Since the larger number is under the x, we know it is horizontal. Remember to find a and b, we have to take the square roots of the denominators. So a = 4 and b = 3.
We can now use a and b to plot the ends of the major and minor axis. This parabola is horizontal and the a value (4) is the distance from the center point to the end of the major axis. Since the major axis is horizontal, we'll count right 4 and left 4 to plot its endpoints.
Now we'll use the b value (3) to find the ends of the minor axis. Let's count up 3 blocks and down 3 blocks and plot the points there.
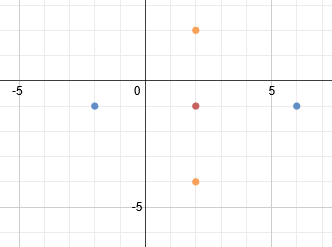
To finish, we simply need to draw in the ellipse.
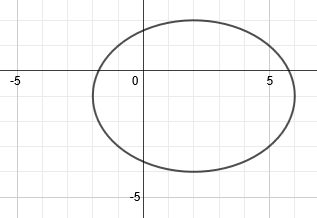
Once again, the center point is not technically part of the answer, so a technical graph would look like this:
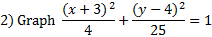
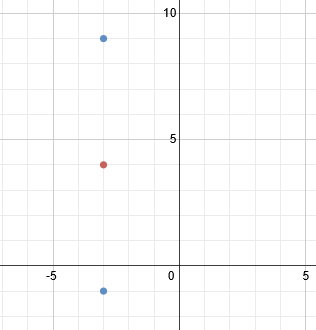
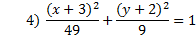
First we must identify the center point, which is (-3, 4). Let's graph it:
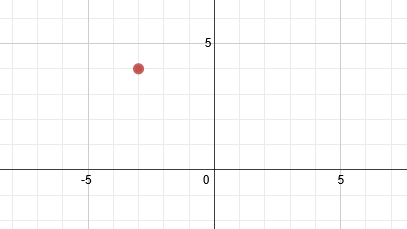
Now we need to determine if the ellipse is vertical or horizontal. Since the larger number is under the y, we know it is vertical. Remember to find a and b, we have to take the square roots of the denominators. So a = 5 and b = 2.
We must now use a and b to plot the ends of the major and minor axis. This parabola is vertical and the a value (5) is the distance from the center point to the end of the major axis. Since the major axis is vertical, we'll count up 5 and down 5 to plot its endpoints.
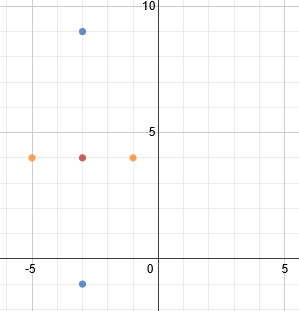
Now we'll use the b value (2) to find the ends of the minor axis. Let's count left 2 blocks and right 2 blocks and plot the points there.
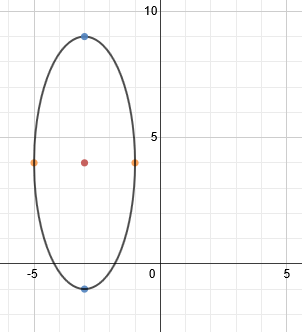
To finish, we simply need to draw in the ellipse.
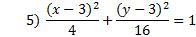
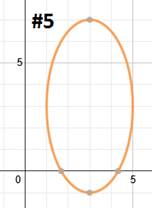
Practice: Graph each ellipse.
Answers:
|
Related Links: Math Fractions Factors |