Graphing a Linear Equation Using a T-Chart
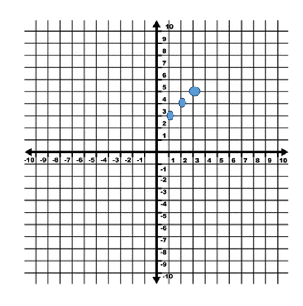
When the x value is 1, the y value is 3.
When the x value is 2, the y value is 4.
When the x value is 3, the y value is 5.
The list could go on and on.
Instead of trying to list out all of the solutions, we can make a graph that extends on forever.
We will start by placing the values we already know are solutions in a table of values, also known as a t-chart.

These values represent the coordinate pairs that will be placed on the graph.

Now we will plot the points on a coordinate plane.
Step 1: Plot the points.
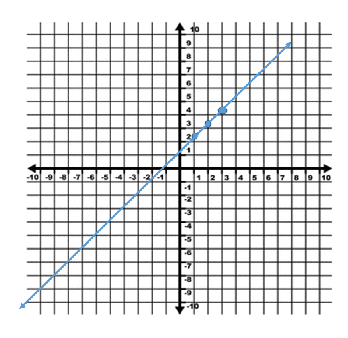
Step 2: Connect the point with a line. (Remember that a line has arrows on both ends.) Be sure to extend the line as far as it can go, from end to end on the graph.
Step 3: Write the equation next to the line to label your work.
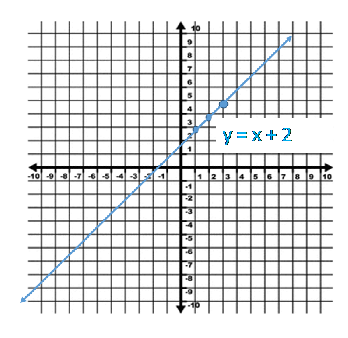
Now, our graph represents all of the possible solutions. Not only can we visually see a ton of different solutions, from positive to negatives, whole numbers to decimals and fractions, but we also have the arrows which show that this equation has more possible solutions in both directions.
Let's Review the steps for graphing with a t-chart or table of values.
1.) Make a t-chart or table of values to show three or more possible solutions.
2.) If you need to, write the solutions as coordinate pairs in a third column.
3.) Plot the coordinate pairs on a graph.
4.) Connect the points using a line with arrows.
5.) Write the equation next to the line.
With just these 5 steps you have shown all the possible solutions to a linear equation!
Related Links:
Math
Fractions
Factors