Parametric Equations: Introduction
To graph this set of parametric equations over the interval from time zero to time 2.5, create a table of values. Then determine the values for x and y by substituting the value of t in their respective equations.
|
Time, t |
0 |
0.5 |
1 |
1.5 |
2 |
2.5 |
|
Distance, x |
0 |
20 |
40 |
60 |
80 |
100 |
|
Height, y y = -16t2 + 40t |
0 |
16 |
24 |
24 |
16 |
0 |
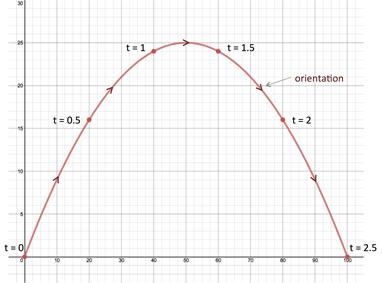
The graph shows that both x, distance, and y, height are continuous functions for t, time. This type of graph is called a plane curve.
The orientation of the plane curve is determined by the increasing values of the parameter. Therefore the orientation for the graph for our example starts at t = 0 and continues to the right as the values of t increase to t = 2.5, as shown by the arrows on the graph.
Let's try a couple of examples.
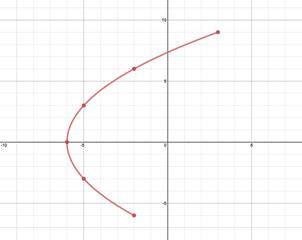
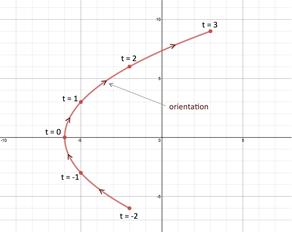
x = t2 - 6
y = 3t
|
Step 1: Create a table of values for the interval .
|
||||||||||||||||||||||||
|
Step 2: Plot the points.
|
||||||||||||||||||||||||
|
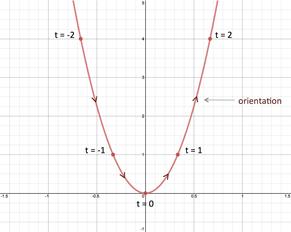
Step 3: Indicate orientation.
The orientation is shown in the graph in the direction of increasing values for the parameter, t. Notice that x does not have to be a function of y (The graph does not pass the vertical line test). Therefore parametric curves can be drawn for more than just functions. In fact two different sets of parametric curves can represent the same plane curve. |
|
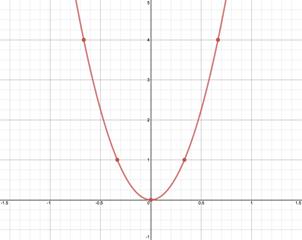
Step 1: Create a table of values for the interval .
|
||||||||||||||||||
|
Step 2: Plot the points.
|
||||||||||||||||||
|
Step 3: Indicate orientation. The orientation is shown in the graph in the direction of increasing values for the parameter, t.
|
|
Related Links: Math algebra Parametric Equations: Eliminating Parameters Parametric Equations: Eliminating Angle Parameters Pre Calculus |
To link to this Parametric Equations: Introduction page, copy the following code to your site: