Graphing the Cosine Function
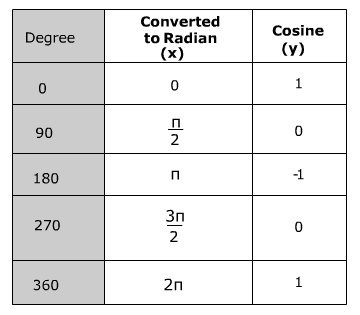
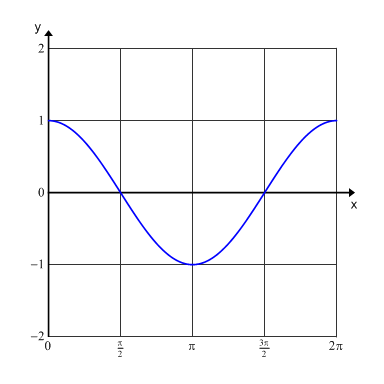
Notice that the domain for the period is from 0 to 2π which is from 0 to 360° and the range is from -1 to 1. However, when you include more than one period the domain becomes all real numbers and the range remains -1 to 1.
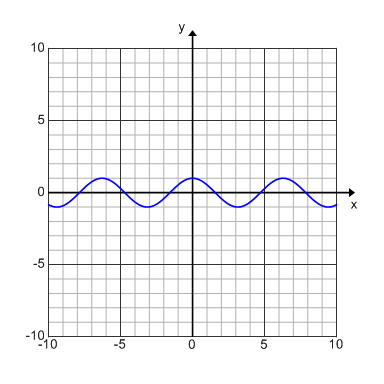
When cosine is graphed over several periods (multiple cycles) it creates a sinusoid wave. The graph above is an example of cos(x) graphed over multiple periods. This graph is also known as a sinusoidal graph.
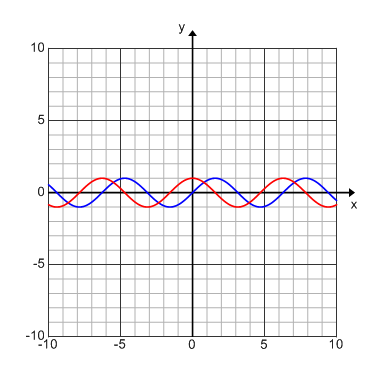
The cosine graph is really the sine graph that has simply been translated. Looking at the graph below the red curve is the graph of cos(x) and the blue curve is the graph of sin(x).
Recall from right triangle trigonometry that a reference angle (an angle between 0° and 360°) can be used to represent all angles that are less than zero or greater than 360°. Therefore the cosine values will repeat every 360° creating the sinusoid wave.
Sine and cosine functions can be used to model many real-life situations, including electric currents, musical tones, radio waves, tides, and weather patterns.
|
Related Links: Math Trigonometry Cotangent, Secant and Cosecant Inverse Cosine Function (Arccosine) |
To link to this Graphing the Cosine Function page, copy the following code to your site: